
HR digitalization
Leading people effectively
HR from 21st century
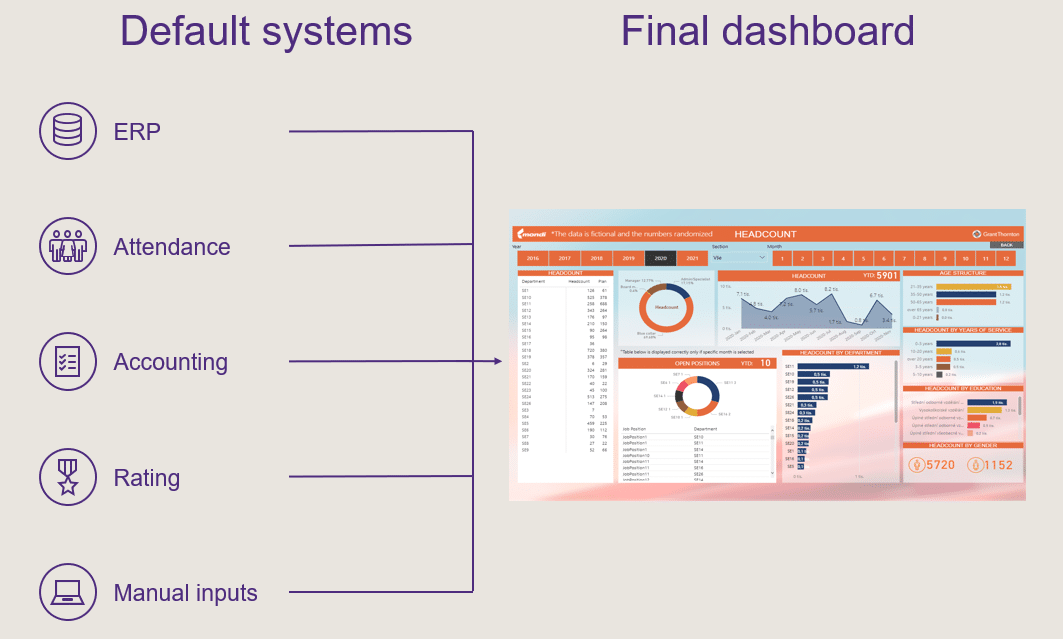
Our solution automates creation of HR reports an makes HR planning more efficient. Our solutions work with multitude of different data sources. Our Power BI report allows for high-level supervision as well as for detailed in depth knowledge of various data sources. Our solution also allows for visualization and filtration with regards to specific company divisions.
Grant Thornton’s multi-disciplinary Data Analytics Services Group uses its in-depth knowledge of Power BI, Python, R and plethora of other data tools in number of sectors including complex manufacturing companies to create tailor made HR reporting. Our experts are able to create data solutions that correspond with specific client needs.
Whether it be a complicated challenge, an unforeseen crisis or just a straightforward technicality, businesses can rely on our team for high quality service and highly reliable guidance.

Jan Havelka
Manager, Financial & Data Services

Jiří Köhler
Head of Financial & Data Services


Final report
What we offer ?

We connect various systems and other data sources

We create new reports in hours

We set indicators in comparison with the plan

We know probabilistic models (fluctuations, recruitment, ..)

We automate reports -> fewer manual tasks

Our solution does not cause vendor lock-in
Our approach to implementation
Definition of indicators (2-3 weeks)
- In the initial phase, the client defines the main areas of interest and defines key HR indicators that should be monitored.
- Indicators may include, for example, fluctuations, age structure or fulfillment of key competencies.
- The indicators will be defined in cooperation with HR management and other managers.
Database (2-3 weeks)
- There will also be an initial survey of the data warehouses used in cooperation with the internal IT department.
- The aim is to prepare the environment for the subsequent implementation and operation of the planning application.
- The database can be represented by several independent sources such as the main company databases and additional MS Excel files.
Connection (2-3 weeks)
- When creating reports in Power BI, it is necessary to define the connection to data sources.
- In the case of databases, it is necessary to make the connection available in order to read data and created queries by the internal IT department.
Modeling (2-3 weeks)
-
The data is further modeled and edited directly in Power BI.
-
There are also combined different data sources that can be interconnected to create interactive and interconnected reports.
-
The logic of modeling is created in cooperation with employees familiar with the issue.
Output (2 weeks)
- In the final phase of creation, only the reports themselves are prepared based on the individual needs of their future users.
- These messages are then made available through personal accounts on the necessary Power BI interface.
Reference
Client requirements and project goal
The client required more flexible HR planning and faster access to HR data with multiple levels of access. In addition, HR data was stored in several locations and in various independent databases. The aim of the project was to integrate the database into the data warehouse and create a simple and fully automated report for HR and HR planning.
Project progress
- Initial analysis revealed disparate data sources, data variously updated in three databases and manually generated reports, which formed the HR area for management
- As part of report automation, this data was unified and interconnected according to the master keys in the created data warehouse in SQL Server Management Studio. A comprehensive HR report was created over this warehouse in the MS Power BI Report Server, where we set up individual analyzes, including a predictive model for improving the strategic management of the HR sector.
Project benefits
- The data analysis helped the client to identify the main data sources and with our support, this data was gradually unified into the main internal database.
- In-depth analyzes alert the client to potential risks in individual sections. The summary dashboard set by us also allows you to monitor KPI values and compare them with the monthly and YTD plan.
- Our ongoing support helped with the adjustment of some methodologies and monitored values.
- Within the project, automatic reporting was set up for the client, enabling long-term monitoring of developments in the areas covered by the project.