Grant Thornton
Instructor
Grant Thornton CZ has years of experience with Power BI. Our firm has worked with many clients, such as PRE, Nakit, and Mondi, to implement Power BI into their workflow. The result from using this solution has been transformative, streamlining processes and unifying enterprise data into a visually immersive central hub.
Chapter 1 : Overview of Power BI Desktop
This chapter provides an overview of the Power BI Desktop application and its various features. You will be introduced to different view modes and master the general functioning of the application.
15 min.
Chapter 2: Loading Data
Chapter 2 will teach you how to upload different types of data, including already existing Power BI reports or Excel files. You can now start creating your first report.
15 min.
Chapter 3 : Visualizations
This chapter outlines the basics of creating and customizing your first Power BI visuals. Learn how to bring your data to life by using the Visualizations Pane and creating graphs, maps, slicers and many more.
15 min.
Chapter 4 : Finalizing & Sharing
Chapter 4 contains finishing steps you might want to implement when finished with your canvas. Learn how to export your report to PDF or share it through the Power BI Online Service. This chapter also hints at the creation of dashboards.
10 min.
Why Power BI & Power BI Products
Why Power BI?
Power BI is a visualization tool, which displays your data clearly and interactively. This allows you to use the newest information effectively. Power IB is used by 97% of Fortune 500 companies and by over 6 million customers worldwide.
Power BI products
Power BI Desktop is a free desktop app, which is used to connect, analyse and visualize data. This tutorial will focus on explaining this product.
Power BI Online Service is a cloud-based service, which allows users to upload their reports and create dashboards.
Power BI Mobile is an app, which can be downloaded for mobile phones and tablets. Allows the user to view dashboards from the Online Service.

Download & Installation of Power BI Desktop
Download
You can download the software at this link. Firstly, select the language in which you wish to download the application. Keep in mind that your choice of language will change the entire page content to that language.
After selecting a language, simply click on the Download button. For this tutorial, we have selected English.

On the website, you will also find Details about the application, System Requirements and Install Instructions. Among other things, it is important to note that you must be running Windows 7 or newer to use this tool.
Installation
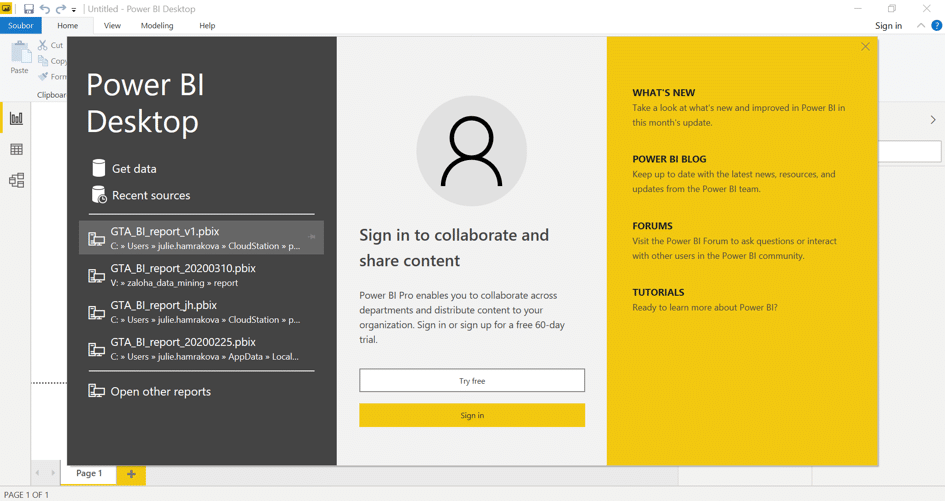
Once the application is downloaded onto your device, run the MSI installer to initiate the Power BI Installation Wizard. After satisfying each requirement, simply click on Next. Then finally click on Install. Once the installation process is complete, click on Finish to launch Power BI Desktop.
Now your Power BI Desktop application is ready to create your reports. Master the basics of the application and explore its features in Chapter 1 of this tutorial.
(You may need an administrator password if using a company locked device.)
Overview of Power BI Desktop


The screen shows 11 main features:
- Ribbon: includes Home, View, Modelling and Help
- Get data: allows for importing data from Excel, CSV, websites, databases & more
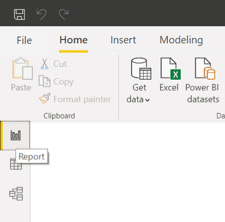
- View selection: default options are Report, Data and Model
- Fields: used for the access to tables and fields (columns) of data – use this for the Visualization (5) and Filters Panes (7).
- Visualizations: used for adding charts, tables, maps and other visuals to the report
- Visual Fields: used for formatting and customizing visualizations (colours, fonts, settings)
- Filters: used for setting report, page and chart level filters
- Canvas: this is where you construct reports
- Save button: reports will be saved as .pbix files
- Publish button: used to publish the reports online, so that others can access them
- Pages: possibility to add more pages to the report
View selection:
- Report view is the default view, which shows you reports and visuals.
- Data view displays data associated with the reports.
- Model view manages relationships between tables of data.
In Model view, you can help Power BI recognize that certain fields of given tables have a connection. You do this by dragging one field onto the next one, resulting in a line connecting the tables.

Interactions
The individual visualizations are interactive, meaning that if you click on a section of a visualization, the corresponding fields in other visualizations shift and adapt. For example, by selecting a country in a Bar Chart, it will spotlight the profit made in that country in a Slicer.

Loading Data
Loading an existing Power BI report
Finished reports can be easily imported by clicking on File and then “Browse reports“. Your imported report can be edited; this might include changing the type of visualization or adding a textbox to create a title.
Excel data
Power BI supports the import of Excel workbooks .xlsx and .xlsm (2007 version and newer), if not bigger than 1 GB. You can load multiple tables.
The data used in this manual is Financial Sample Workbook for Power BI, provided by Microsoft (available here: https://docs.microsoft.com/en-us/power-bi/sample-financial-download).
- Click on Get data button and select Excel as the source.
- Point to the downloaded sample data. After loading, the Navigator should show up.

- For our purposes, select ‘Sheet 1’. Preview should be displayed. Click on Load Button to load the data.
Other types of data
Power BI supports the import of data from web, CSV and a range of other formats.
For example, this is how you can load data from Wikipedia page:
Metrics in our table are displayed together with the information about the country. Imagine we would like to visualize metrics not only by countries, but also by global regions. As we do not have this information in our data, we need to add new source.
Luckily, we can use this Wikipedia page with the table that contains the information we need:
https://meta.wikimedia.org/wiki/List_of_countries_by_regional_classification.
To combine data, we firstly add this source:
- Click on dropdown arrow icon next to the New Source Button in the New Query Group of Home tab. Select Web option. Insert the URL link into the window that appears and click OK. In the Navigator pane tick the Source[edit], in this case.


Now we can combine both tables into one (in Power BI terminology queries).
There are two primary ways how to combine data – merge and append. When you have one or more columns you would like to add to another query, you merge the queries. When you have additional rows of data you would like to add to one of queries, you append the query.
As we want to add information to our original query, we firstly select Sheet1, then click on Merge Queries on Combine Group from Home Tab. In the window that shows up, we select to merge Sheet1 with Sources[edit]. We also select column Country in both as the matching columns. Lastly, we choose the Join Kind. For our case, as we want to add information to our original table, Left Outer is the best option.


As result, there are three new rows in the Sheet1.
Visualizations in Power BI
Basics
You can build visualizations and reports in the Report View (can be found on View Selection).

To create a new visualization, click on the canvas and select the desired visual. Then select the fields you want it to display from the Fields Pane. At this point, the Fields Pane should include data from a previously uploaded dataset, as explained in Chapter 2.
Visualizations Pane
The Visualizations Pane shows the information about visuals and lets you modify them.

- Power BI automatically creates a bar chart, but that can be easily altered by clicking on the bar chart and then selecting your desired type of visualization in the Visualizations Pane, as shown by the icon. To add another visualization to the report, simply click on a blank space on the canvas and select the type of visualization you want to create. Then select the fields you want to include in the Fields Pane.

2. Fields option lets you drag the data into different fields (they vary with different types).
3. Format option lets you format various features in the visualization (title, background, border, axis, …).
4. Analytics option is available only for some of the types of visualization. You can add dynamic reference lines to visualizations and provide focus for important trends or insights.
Finalizing & Sharing
Basics
Once your visualizations are present (or as you create them) in the canvas, feel free to resize and rearrange them. You can also use the textbox function to create a title or descriptions. The text can be standardly customized.
Sharing options
Sharing
Your reports can be shared simply by sending the .pbix file to a colleague. Your colleague has to have Power BI Desktop downloaded on their computer to open the file.
Exporting the report to PDF
To export your report into PDF, simply click on File and then Export to PDF file.
Uploading to a Power BI cloud
Your finished report can also be uploaded to the cloud-based Power BI Online Service. Simply click on Publish in the Menu bar. From the Online Service, the dashboards can be shared to Power BI Desktop or Power BI Mobile.
Reports and dashboards can also be shared using the Power BI Online Service. Further, dashboards are visible on-the-go to Power BI Mobile users.
Creating dashboards
Dashboard is an interface, which provides a visual overview of a business and is limited to one page. In comparison, Reports are more detailed, displayed in different formats and created from datasets. In the Power BI Online Service, you can create Dashboards by composing them from your Reports created in Power BI Desktop.

Ready to get started?
Get in touch!


